
Google Gantt Charts Inside GeneXus: The GX Google Gantt Chart User Control
Project timelines are one of those UI problems GeneXus doesn't solve out of the box — you either embed a JS charting library by hand or you skip the visual and ship a grid. GX Google Gantt Chart is the middle path: a user control that wraps Google's Gantt Chart visualization and drives it entirely from a GeneXus SDT.
What it does
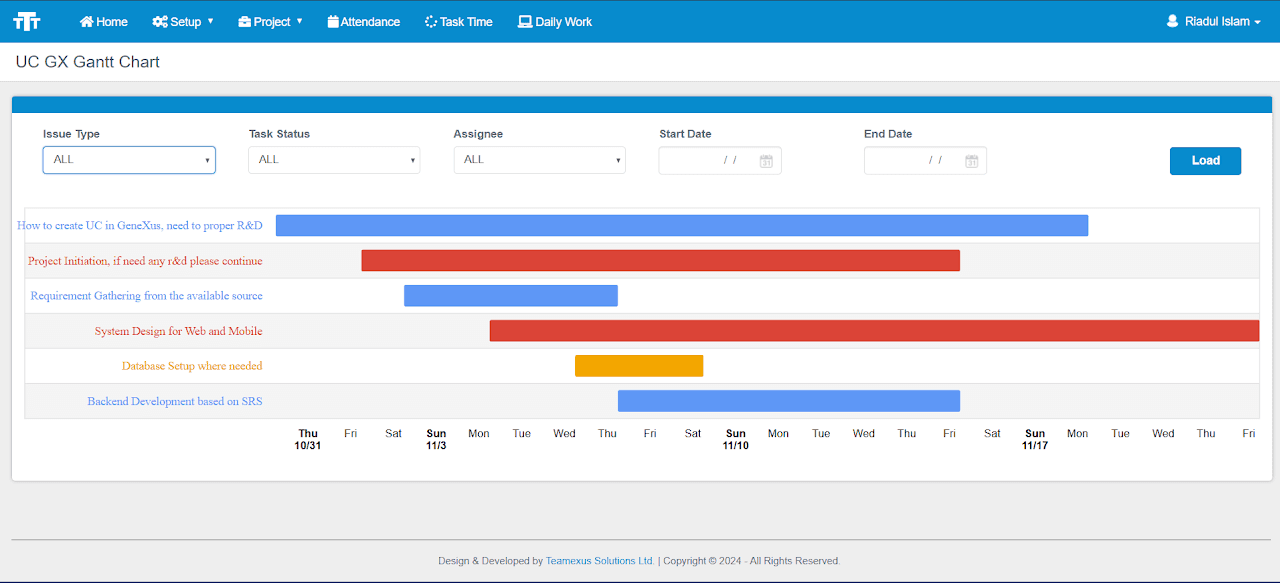
You bind a collection of tasks to the control and it renders a full interactive timeline — dependencies, grouping by resource, completion percentages, and critical-path highlighting are all supported natively, and the whole thing is styled through design-time properties rather than CSS you'd have to maintain separately.
Installing it
- Download
GoogleGanttChart_V1.0.xpzfrom the GitHub repo. - Knowledge Manager → Import → Select KB → Load → Import, then choose the
.xpz. - Drag
UCGoogleGanttChartonto a Web Panel from the Toolbox.
The data model
Everything the chart renders comes from one SDT, GanttChartItems, which needs eight fields per task:
TaskID,TaskName,TaskResourceTaskStartDate,TaskEndDateTaskDurationMillisecondTaskPercentCompleteTaskDependencies
Populate that collection from whatever your actual project/task table looks like — the control doesn't care where the data comes from, only that the SDT shape matches.
Styling and behaviour
Beyond Height, Width, and GanttChartItems itself, there are just over 30 design-time properties, grouped by what they touch:
- Layout —
TrackHeight,BarHeight,BarCornerRadius - Arrows —
ArrowLength,ArrowWidth,ArrowAngle,ArrowColor,ArrowRadius,ArrowSpaceAfter - Grid —
GridHorizlineStroke,GridHorizlineStrokeWidth,GridTrackColor,GridDarkTrackColor - Labels —
LabelMaxWidth,LabelFontName,LabelFontSize,LabelColor - Critical path —
CriticalPathEnabled,CriticalPathStroke,CriticalPathStrokeWidth - Completion % —
PercentEnabled,PercentColor - Shadow —
ShadowEnabled,ShadowColor,ShadowOffset - Misc —
BackgroundColor,GroupingResources,DefaultStartDate,SortTasks
Turning on CriticalPathEnabled is usually the first thing worth doing for anything beyond a toy demo — it's the one feature that turns the chart from "a timeline picture" into an actual planning tool, since it highlights the task chain that actually determines your project's end date.
Wiring it up
A trimmed version of the reference implementation — six tasks with a real dependency graph (Complete depends on both Cite and Write; Write, Cite, and Outline all depend on Research):
// &GoogleChartItems type is GoogleChartItems SDT
// &GoogleTaskItem type is GoogleChartItems.TaskItem SDT

&GoogleChartItems.Clear()

&GoogleTaskItem = New()
&GoogleTaskItem.TaskID = !'Research'
&GoogleTaskItem.TaskName = !'Find sources'
&GoogleTaskItem.TaskResource = !'Resource 1'
&GoogleTaskItem.TaskStartDate = &Today.AddDays(1)
&GoogleTaskItem.TaskEndDate = &Today.AddDays(5)
&GoogleTaskItem.TaskDurationMillisecond = 0
&GoogleTaskItem.TaskPercentComplete = 100
&GoogleTaskItem.TaskDependencies = !'null'
&GoogleChartItems.Add(&GoogleTaskItem)

&GoogleTaskItem = New()
&GoogleTaskItem.TaskID = !'Write'
&GoogleTaskItem.TaskName = !'Write paper'
&GoogleTaskItem.TaskResource = !'Resource 1'
&GoogleTaskItem.TaskStartDate.Set(0, 0, 0)
&GoogleTaskItem.TaskEndDate = &Today.AddDays(9)
&GoogleTaskItem.TaskDurationMillisecond = 3 * 24 * 60 * 60 * 1000
&GoogleTaskItem.TaskPercentComplete = 25
&GoogleTaskItem.TaskDependencies = !'Research,Outline'
&GoogleChartItems.Add(&GoogleTaskItem)

&GoogleTaskItem = New()
&GoogleTaskItem.TaskID = !'Outline'
&GoogleTaskItem.TaskName = !'Outline paper'
&GoogleTaskItem.TaskResource = !'Resource 4'
&GoogleTaskItem.TaskStartDate.Set(0, 0, 0)
&GoogleTaskItem.TaskEndDate = &Today.AddDays(6)
&GoogleTaskItem.TaskDurationMillisecond = 1 * 24 * 60 * 60 * 1000
&GoogleTaskItem.TaskPercentComplete = 100
&GoogleTaskItem.TaskDependencies = !'Research'
&GoogleChartItems.Add(&GoogleTaskItem)

&GoogleTaskItem = New()
&GoogleTaskItem.TaskID = !'Complete'
&GoogleTaskItem.TaskName = !'Hand in paper'
&GoogleTaskItem.TaskResource = !'Resource 4'
&GoogleTaskItem.TaskStartDate.Set(0, 0, 0)
&GoogleTaskItem.TaskEndDate = &Today.AddDays(10)
&GoogleTaskItem.TaskDurationMillisecond = 1 * 24 * 60 * 60 * 1000
&GoogleTaskItem.TaskPercentComplete = 0
&GoogleTaskItem.TaskDependencies = !'Cite,Write'
&GoogleChartItems.Add(&GoogleTaskItem)

// Cite (depends on Research) and Discuss (depends on Cite) follow
// the same pattern — see the full reference for both.
A couple of details worth noting from that snippet: TaskDependencies is a comma-separated string of other tasks' TaskIDs, not a nested collection — !'Cite,Write' means "wait for both." And TaskStartDate.Set(0, 0, 0) is how the reference leaves a start date unset when only the duration matters; most of your own tasks will set both dates explicitly like Research does above.
FAQ
Do I need to know JavaScript or HTML to use this? No — the control wraps the Google Gantt Chart entirely within GeneXus, using Web Panels, SDTs, and standard GeneXus code.
Does it scale to large projects? Yes. It supports multiple tasks, dependencies, and groupings, so it adapts from a small to-do list up to a multi-phase project.
Can I customize the look and feel?
Yes — properties like BarHeight, ArrowColor, LabelFontSize, GridColors, and ShadowColor cover most of what you'd want to restyle.
Getting it
GX Google Gantt Chart is on the GeneXus Marketplace and the source is on GitHub. Support: support@teamexus.com.